Introduction
The measurement of visual acuity enables physicians to communicate with the patient, as well as other physicians, the level of preservation or degradation of vision. Visual acuity serves as a report card for the clinical ophthalmologist, measuring how well a patient is being treated and the effectiveness of new treatment methods.
Types of Visual Acuity
Visual acuity can be classified into three different types: minimum visible acuity, minimum resolvable (ordinary) acuity, and minimum discriminable acuity (hyperacuity). Minimum visibility refers to detecting the presence or absence of a target. The determination is accomplished by gradually increasing the size of a target. This results in an increase in the target’s contrast until it is rendered minimally visible. The threshold is of the order of 1 second of arc. Psychophysical questioning that would pertain to determining minimum visibility is: Is there a line visible in a field?
Minimum resolvable acuity refers to the ability to determine the presence of, or distinguish among, more than one identifying feature in a visible target. This type of acuity is applied clinically when an ophthalmologist determines Snellen visual acuity. Conceptually, minimum resolvable acuity can be described as when members of a point or line pair are moved apart until the observer can identify them as separate. For example, determining if an optotype resembles a C or an O depends on identifying the presence of a gap in the letter. Another example would be if the optotype is presented up, down, left, or right. By varying the object size or spacing between object components, one could determine the minimum resolvable threshold, which for humans is 30 seconds of arc.
Minimum discriminable acuity (hyperacuity) refers to determining the relative location of two or more visible features with regard to each other. For example, in alignment of vernier acuity, one vertical line is displaced until the observer can determine if the upper line is to the right or left of the lower line. The threshold of discrimination is 3 seconds of arc. Slide 1 demonstrates typical target configuration for hyperacuity. A clinical example of minimum discriminable acuity would be aligning the mires when reading a patient’s ocular pressure with applanation tonometry.
Methods of Measurement of Visual Acuity
In the United States, Snellen acuity is the most widely used method for determining visual acuity. The letters are constructed so that the entire letter subtends an angle of 5 minutes of arc, and each part of the letter subtends an angle of 1 minute. For example, the letter E is divided into five parts, three of the parts are solid lines, and two of the parts are spaces between the lines. Each of these parts are the same size and subtend the same number of degrees, namely 1 minute of arc. In the clinical notation, the numerator refers to the testing distance (feet or meters) and the denominator refers to the distance at which the letter would subtend an angle of 5 minutes of arc. For example, a 200 letter would subtend 5 minutes of arc at 200 feet. At 20 feet, it would subtend 50 minutes of arc, because it is 10 times the size of a 20 letter. Slide 2 is an example of a Snellen letter with the appropriate arc minutes specified. Any increase by 1 minute of arc in the minimum angle of resolution reduces the visual efficiency to 86% of its preceding value as determined by Snell and Sterling.1 Table 1 compares the percentage of reduction in central visual acuity to Snellen visual acuity.
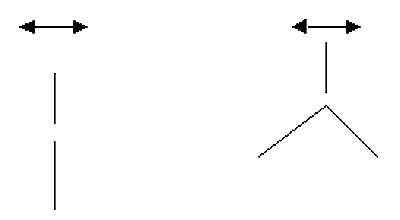
Table 1. Visual efficiency.
| Snellen’s visual acuity | Snell-Sterling’s visual efficiency (%) |
| 20/20 | 100 |
| 20/25 | 96 |
| 20/30 | 91 |
| 20/40 | 84 |
| 20/50 | 76 |
| 20/60 | 70 |
| 20/80 | 58 |
| 20/100 | 49 |
| 20/150 | 31 |
| 20/200 | 20 |
| 20/400 | 3 |
Illiterate E charts, as well as Landolt C test, are also based on minimum resolvable visual acuity. In these charts, the letters are rotated and the observer determines the direction of the opening in the optotype, that is, which direction the letter points. These tests are useful for children who are not familiar with all of the letters of the alphabet. Another test for children includes an HOTV chart, in which the patient will match letters from a display chart to a handheld chart. The Allen chart consists of pictures that are also based on minimum resolvable visual acuity. Recent evidence shows that not all of the pictures are equally resolvable but the test remains clinically useful for illiterate children. For infants, visual acuity may be described with regard to fixation (central or eccentric), ability to follow an object, and maintaining fixation versus sporadic fixation and whether fixation is steady or unsteady. Abbreviations include FFM for fix, follow, and maintain, or CSM, which represents central, steady, and maintain fixation. Central fixation implies the fovea is fixating (as opposed to eccentric fixation: extrafoveal). Steady fixation implies an uninterrupted ability to fixate (nystagmus would be an example of unsteady fixation). Maintaining fixation indicates that fixation is maintained in the eye after a cover is removed from the opposite eye. Determining whether fixation is maintained requires strabismus to be present, either naturally occurring strabismus, or a vertical deviation induced by a 10 prism diopter (D), base-down prism, placed in front of one eye and later the opposite eye, as well. For example, a child with esotropia has a significant fixation preference for the right eye but shows central and steady fixation with either eye. The left eye becomes esotropic each time the cover is removed from the right eye. When the cover is removed from the left eye, the right eye remains fixated on the target. The visual acuity would be recorded:
visual acuity OD = CSM, OS = CS not M.
The crowding phenomenon refers to the fact that when displaying letters in a row versus displaying single letters, the visual acuity will be worse when checked with a whole row of letters in patients that have amblyopia. This may relate to the size of the central receptive fields in amblyopia and the degree of lateral inhibition. In patients with amblyopia, it is preferable to measure visual acuity with a row of letters so that visual acuity will not be overestimated in the amblyopic eye.
The Early Treatment Diabetic Retinopathy Study (ETDRS) chart consists of 10 letters, C, O, S, D, Z, N, H V, R, and K. These letters are displayed with standard illumination and contrast sensitivity in an effort to standardize visual acuity results. In addition, they are spaced proportional to size. Each line has five letters, and the space between the letters is equal to the letter size on that line. The progression of optotype heights is geometric, decreasing in 0.1 log unit increments. A three line (15 letter) decrease in acuity on the chart corresponds to a halving of the visual angle, making mathematical comparisons of visual acuities simpler.
Although this chart is helpful in standardizing visual acuity results, there is still a difference in the relative difficulty of certain letters. The four letters with curved contours (C, O, S, and D) were more difficult to discern at threshold than the six letters (Z, N, H, V, R, and K) composed of straight lines. In addition, under these test conditions, letters at the end of a line were more likely to be read incorrectly than letters at the beginning of the line.1
Stereoacuity
Because the eyes are separated by 65 mm in the horizontal plane of the head, each eye will have a horizontally disparate view of any object in space. Stereopsis, which is derived from the Greek word stereos meaning solid, is the ability to use horizontal disparity cues to construct a perception of solid depth. Stereoacuity is the smallest binocular disparity that can be reliably detected. It is reported most commonly in arc seconds. If an object falls outside of the Panum fusional area, the visual disparity will be too large for fusion, and instead of appearing with depth, will be perceived as double.
Factors Affecting Visual Acuity
Refractive Error
Visual acuity will decrease
if the optics of the eye are defocused. For example, if the amount of defocus
is 1 D, the visual acuity may decrease from 20/15 to 20/40. The amount of
visual acuity drop is proportional to the amount of defocusing. For example, a
patient with 2 D of myopia will be more defocused than a patient with 0.5 D of
myopia.
Retinal Eccentricity
The further fixation is from
the center of fovea, the lower the level of acuity will be. For example, 1°
away from the fovea, there is a reduction to 60% of maximum acuity.2
At the fovea, the visual acuity will be maximal.
Luminance
Increasing relative
luminance increases the relative visual acuity through a wide range of
luminances. The curve is bimodal, indicating the separate contributions of the
rod and cones to the curve. Both very high and very low luminances cause a
reduction in visual acuity.3 This is evident clinically by a
decrease in vision when it is very dark or very bright (blinding bright light).
Contrast
Increasing the level of
contrast increases the resolution at a given luminance level. The ETDRS uses a
single level of contrast to ensure accurate visual acuity testing. Vernier
alignment acuity is less severely affected by varying the contrast than
stereoscopic acuity.4
Pupil Size
Increasing the pupil size in
general increases visual acuity by letting in more light. A very large pupil,
however, will allow spherical aberration in which light rays striking the
crystalline lens’ periphery are refracted more strongly, causing the image to
move forward toward the vitreous, effectively producing myopia. In addition,
the larger pupil may also reveal irregular astigmatism, causing a blurred
image. A small pupil compared with a larger pupil has a larger depth of focus.
This becomes important when any degree of ametropia exists. With any degree of
ametropia, a blurred circle will be projected to the retina instead of a
distinct point of light. By decreasing the aperture of the pupil, a smaller
blurred circle will be projected to the retina and will thereby sharpen the
retinal image. This smaller blurred circle results in a greater depth of focus
with a small pupil. If a pupil is too small, however, it will block too much
light and decrease visual acuity. A pinhole device increases the depth of focus
by decreasing the size of the blurred circle projected on the retina.
Exposure Duration
Decreasing exposure duration
will decrease the visual acuity. This can be offset, however, by increasing the
level of luminance to ensure the constancy of the number of absorbed quanta.5
Target and Eye Movements
Strict stability of the
retinal image is not required for optimum resolution, but if there is
significant movement of the retinal image, such as during a saccade, the visual
acuity will decrease. If a smooth pursuit movement will enable tracking of an
object, the visual acuity will only be slightly decreased.
Meridional variations in acuity
Meridional variations in
visual acuity have been reported, usually favoring horizontal or vertical
meridians.
Interaction Effects
When objects are too close
together, the level of visual acuity decreases. This is not purely optical in
origin, because there is no linear drop in visual acuity with intertarget
distance.
Developmental Aspects
Visual acuity sharpens as an
infant ages. The age at which a child will attain a normal level of adult
visual acuity is controversial and depends on the technique used to determine
the visual acuity. By using preferential looking tests, the age for 20/20 will
be 18 to 24 months, with visual evoked potential, the age will be 6 to 12
months, and by using optokinetic nystagmus, the age will be 20 to 30 months.6
On average, people will retain their ability to see 20/20 until the age of 62.
After this age, less than 50% of people will retain their ability to see 20/20.7
References
- Ferris Fl, Freilin V, Kassoff A, Green SB, Milton RC. Relative letter and position difficulty on visual acuity charts from the early treatment diabetic retinopathy study. Am J Ophthalmol. 1993;116(6):735-740.
- Weymouth FW, et al. Visual acuity within the area centralis and its relation to eye movements and fixation. Am J Ophthalmol. 1928;11:947.
- Shlaer S. The relation between visual acuity and illumination. J Gen Physiol. 1937;21:165.
- Westheimer G, Pettet MW. Contrast and duration of exposure differentially affect vernier and stereoscopic acuity. Proc Roy Soc London. 1990;B241:42.
- Graham CH, Cook C. Visual acuity as a function of intensity and exposure time. Am J Psychol. 1937;49:654.
- Dobson V, Teller D. Visual acuity in human infants: A review and comparison of behavioral and electrophysiological studies. Vision Res. 1978;18:1469.
- Weymouth FW. The effect of age on visual acuity. In: Hirsch MJ, Wick RE, eds. Vision of the Aging Patient. Philadelphia, Pa: Chilton; 1960.
Bibliography
Westheimer G. Visual acuity. In: Hart WM, ed. Adler’s Physiology of the Eye: Clinical Application, 9th ed. St. Louis, Mo: CV Mosby; 1992.